The Meta ads metrics that tell you if an ad is working
ROAS and cost per purchase tell you what happened. These twelve tell you why, and what to change next.
On this page
- Set up one column view for creative
- 1. Hook rate: is the first second working?
- 2. Hold rate: does the middle keep them?
- 3. Outbound CTR, not CTR (all)
- 4. Landing page view rate: did they arrive?
- 5. Purchases per 100 clicks: the conversion rate that belongs to the ad
- 6. CPM, read in context
- 7. Frequency, only next to CTR and cost per purchase
- 8. The attribution setting behind every number
- 9. New-customer share
- 10. MER and break-even ROAS
- 11. Marginal ROAS: what the extra spend brought back
- 12. Hit rate: is the creative pipeline working?
- How we read them together
Most ecom brands judge their Meta ads on two numbers: ROAS and cost per purchase. They’re the right numbers to be paid on. They’re the wrong numbers to diagnose with. When cost per purchase jumps, ROAS won’t tell you whether the opening stopped working, the page got slower, the ad ran out of new people, or Meta started counting differently.
These are the twelve numbers we pull before we change anything in an account. Most aren’t switched on by default, and a few of them mislead when you read them alone. So for each one: what it tells you, how to get it, and where it trips people up.
The short version
- Pay attention to cost per purchase. Diagnose with the ratios underneath it.
- Hook rate tells you if the first second works. It doesn’t tell you if the ad sells.
- Compare ads on the same attribution setting, or you’re measuring with different rulers.
- MER, new-customer share and marginal ROAS decide whether the next £1,000 is worth spending.
Set up one column view for creative
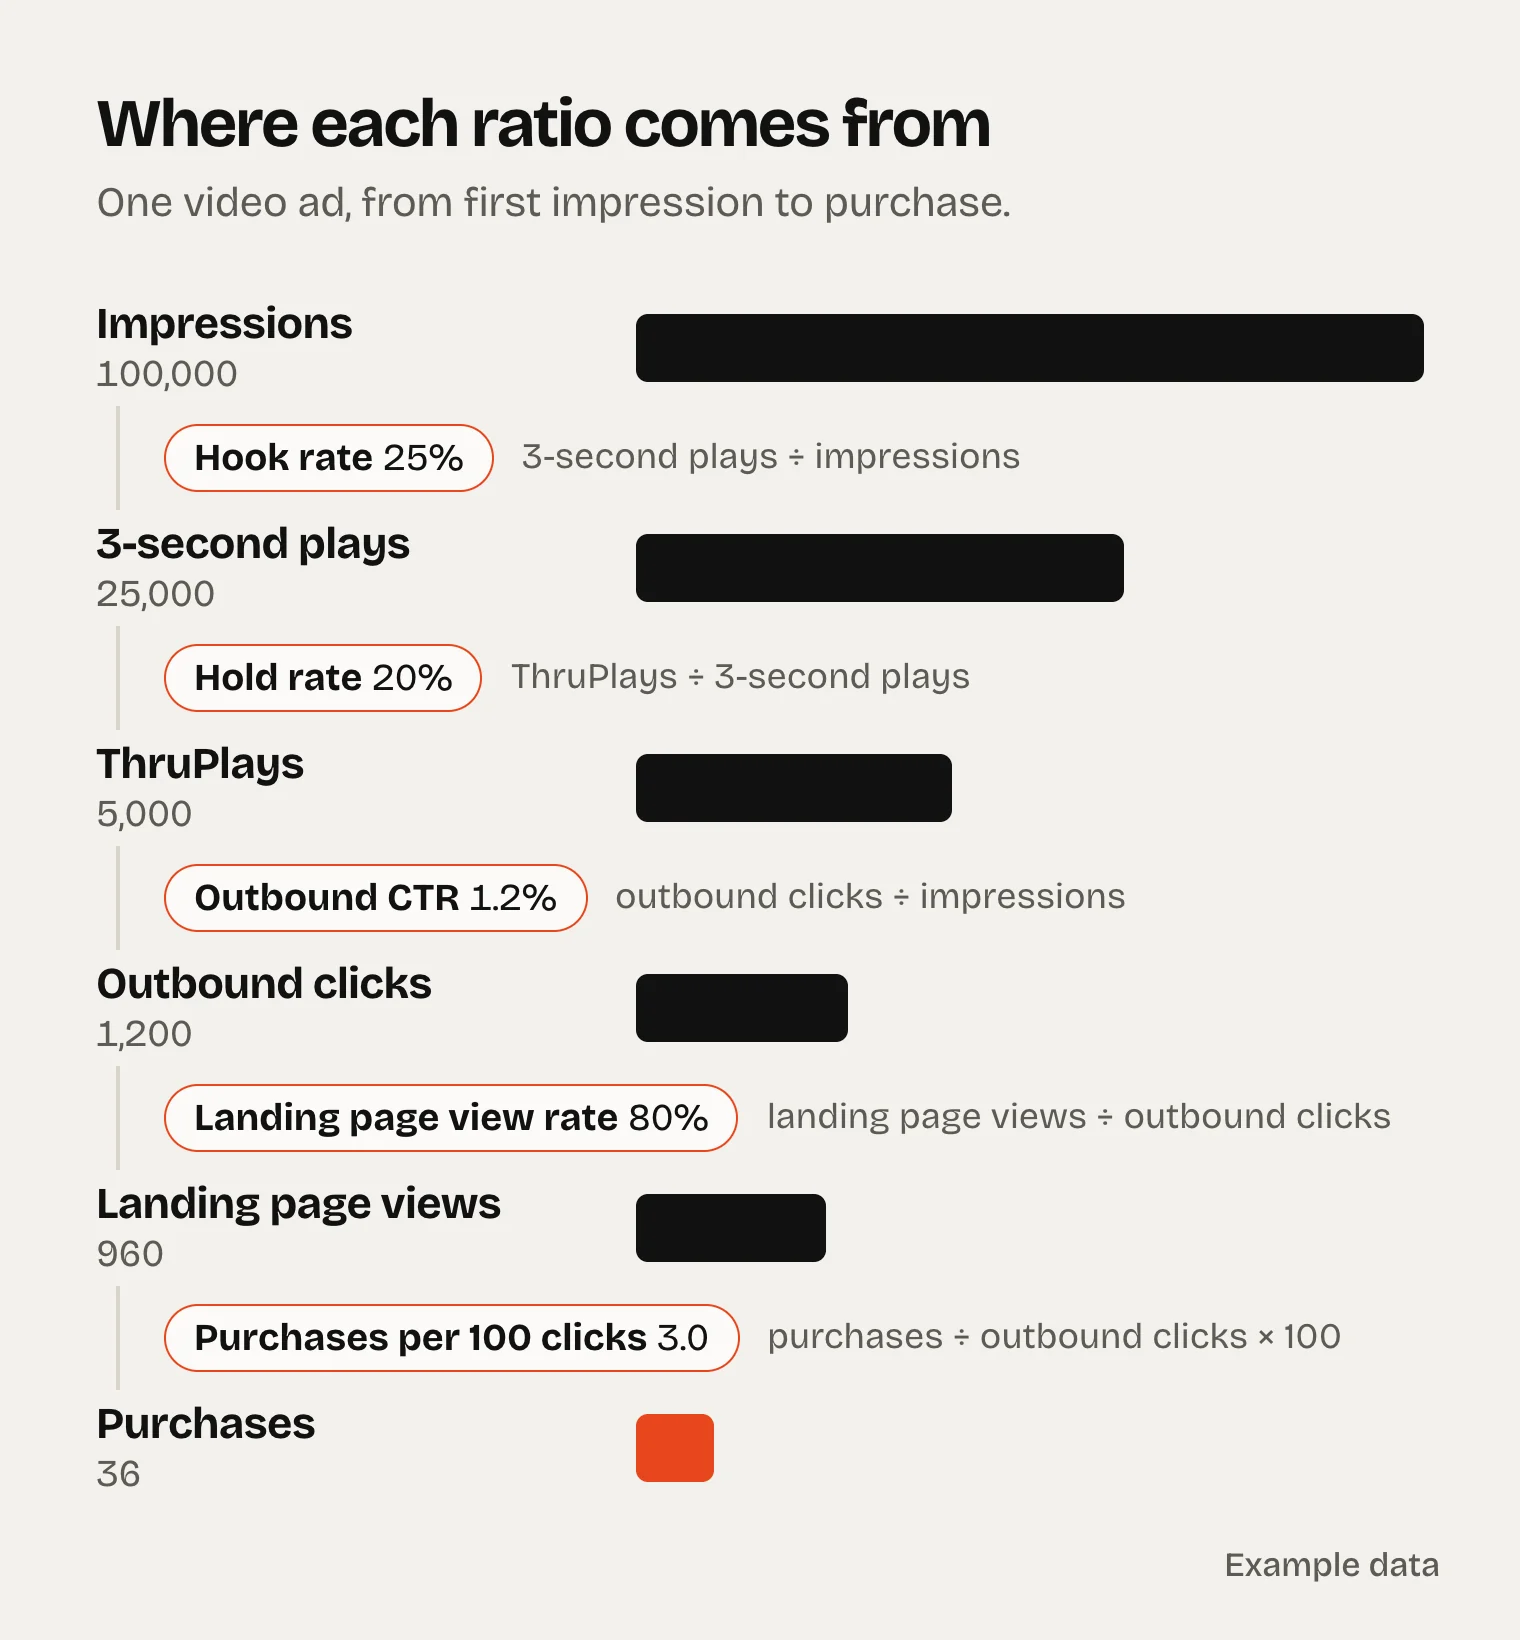
Ads Manager doesn’t show most of these out of the box. Open Columns, choose Customise columns, and use Create custom metric for the ratios Meta doesn’t calculate for you:
Hook rate = 3-second video plays ÷ impressions
Hold rate = ThruPlays ÷ 3-second video plays
Landing page view rate = landing page views ÷ outbound clicks
Purchases per 100 clicks = purchases ÷ outbound clicks × 100
Save it as a preset with spend, outbound CTR, CPM, frequency, purchases and cost per purchase. Every ratio below is one step between the first impression and the order.
1. Hook rate: is the first second working?
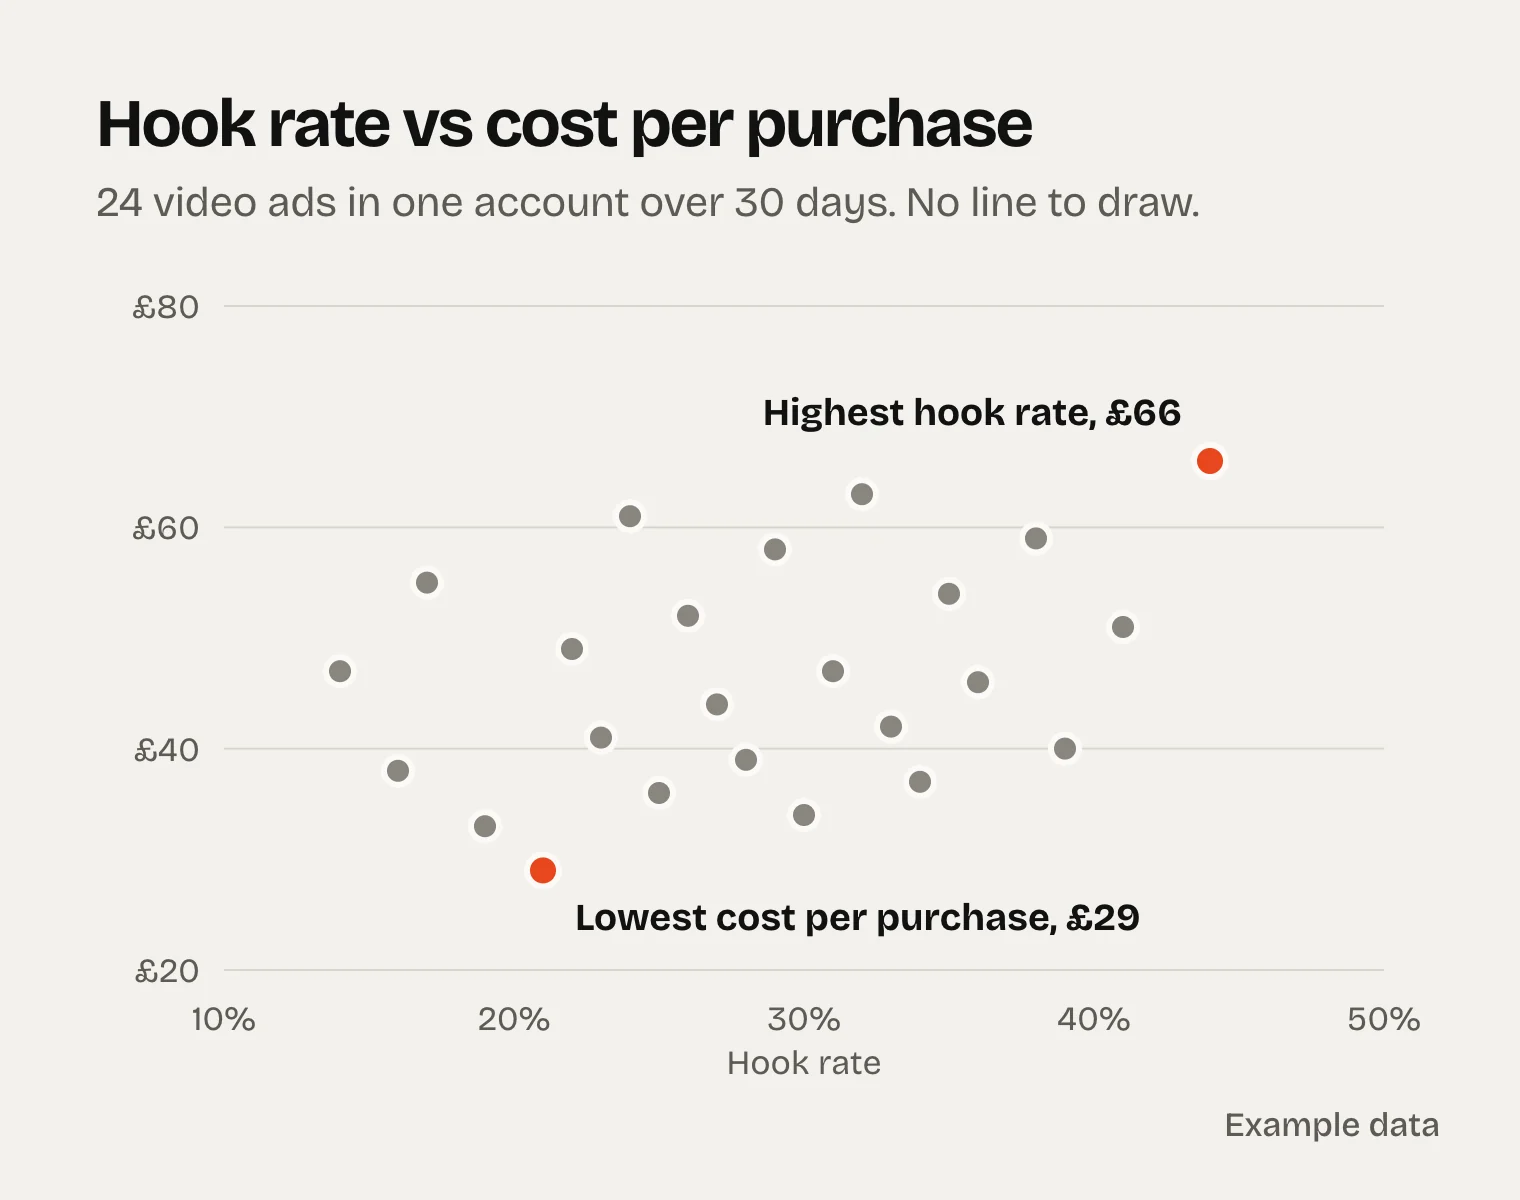
Hook rate is the share of impressions that turn into a 3-second view. It measures one thing: whether the opening frame and line earn a pause. For ecom video in feed, 25% to 35% is a normal range in the accounts we run. Below 20%, the opening is the first thing to fix.
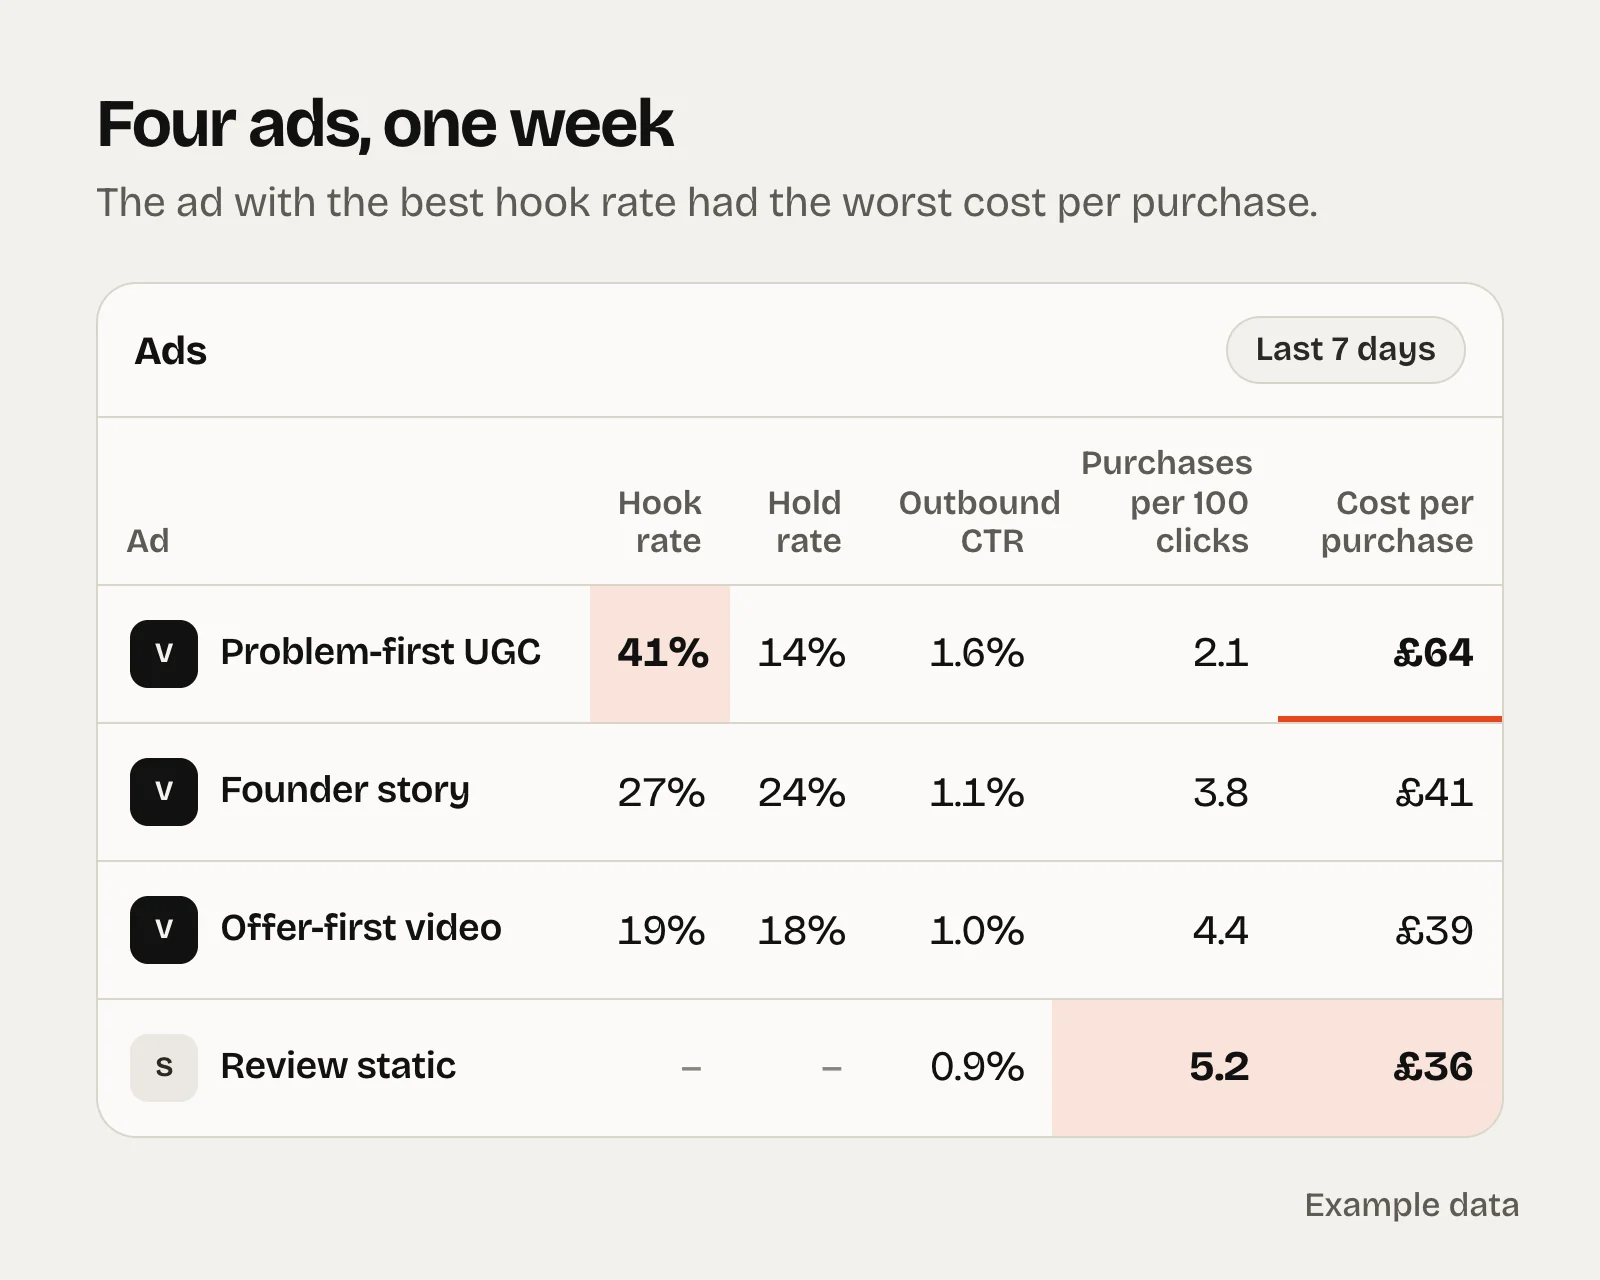
The trap is treating it as a sign the ad will sell. It isn’t. In a pet supplements account we run, the videos with the highest hook rates sold worse than average, and some of the weakest openers were among the most efficient ads in the account. Problem-first and fear-led openings stop plenty of thumbs. They also attract people who were never going to buy.
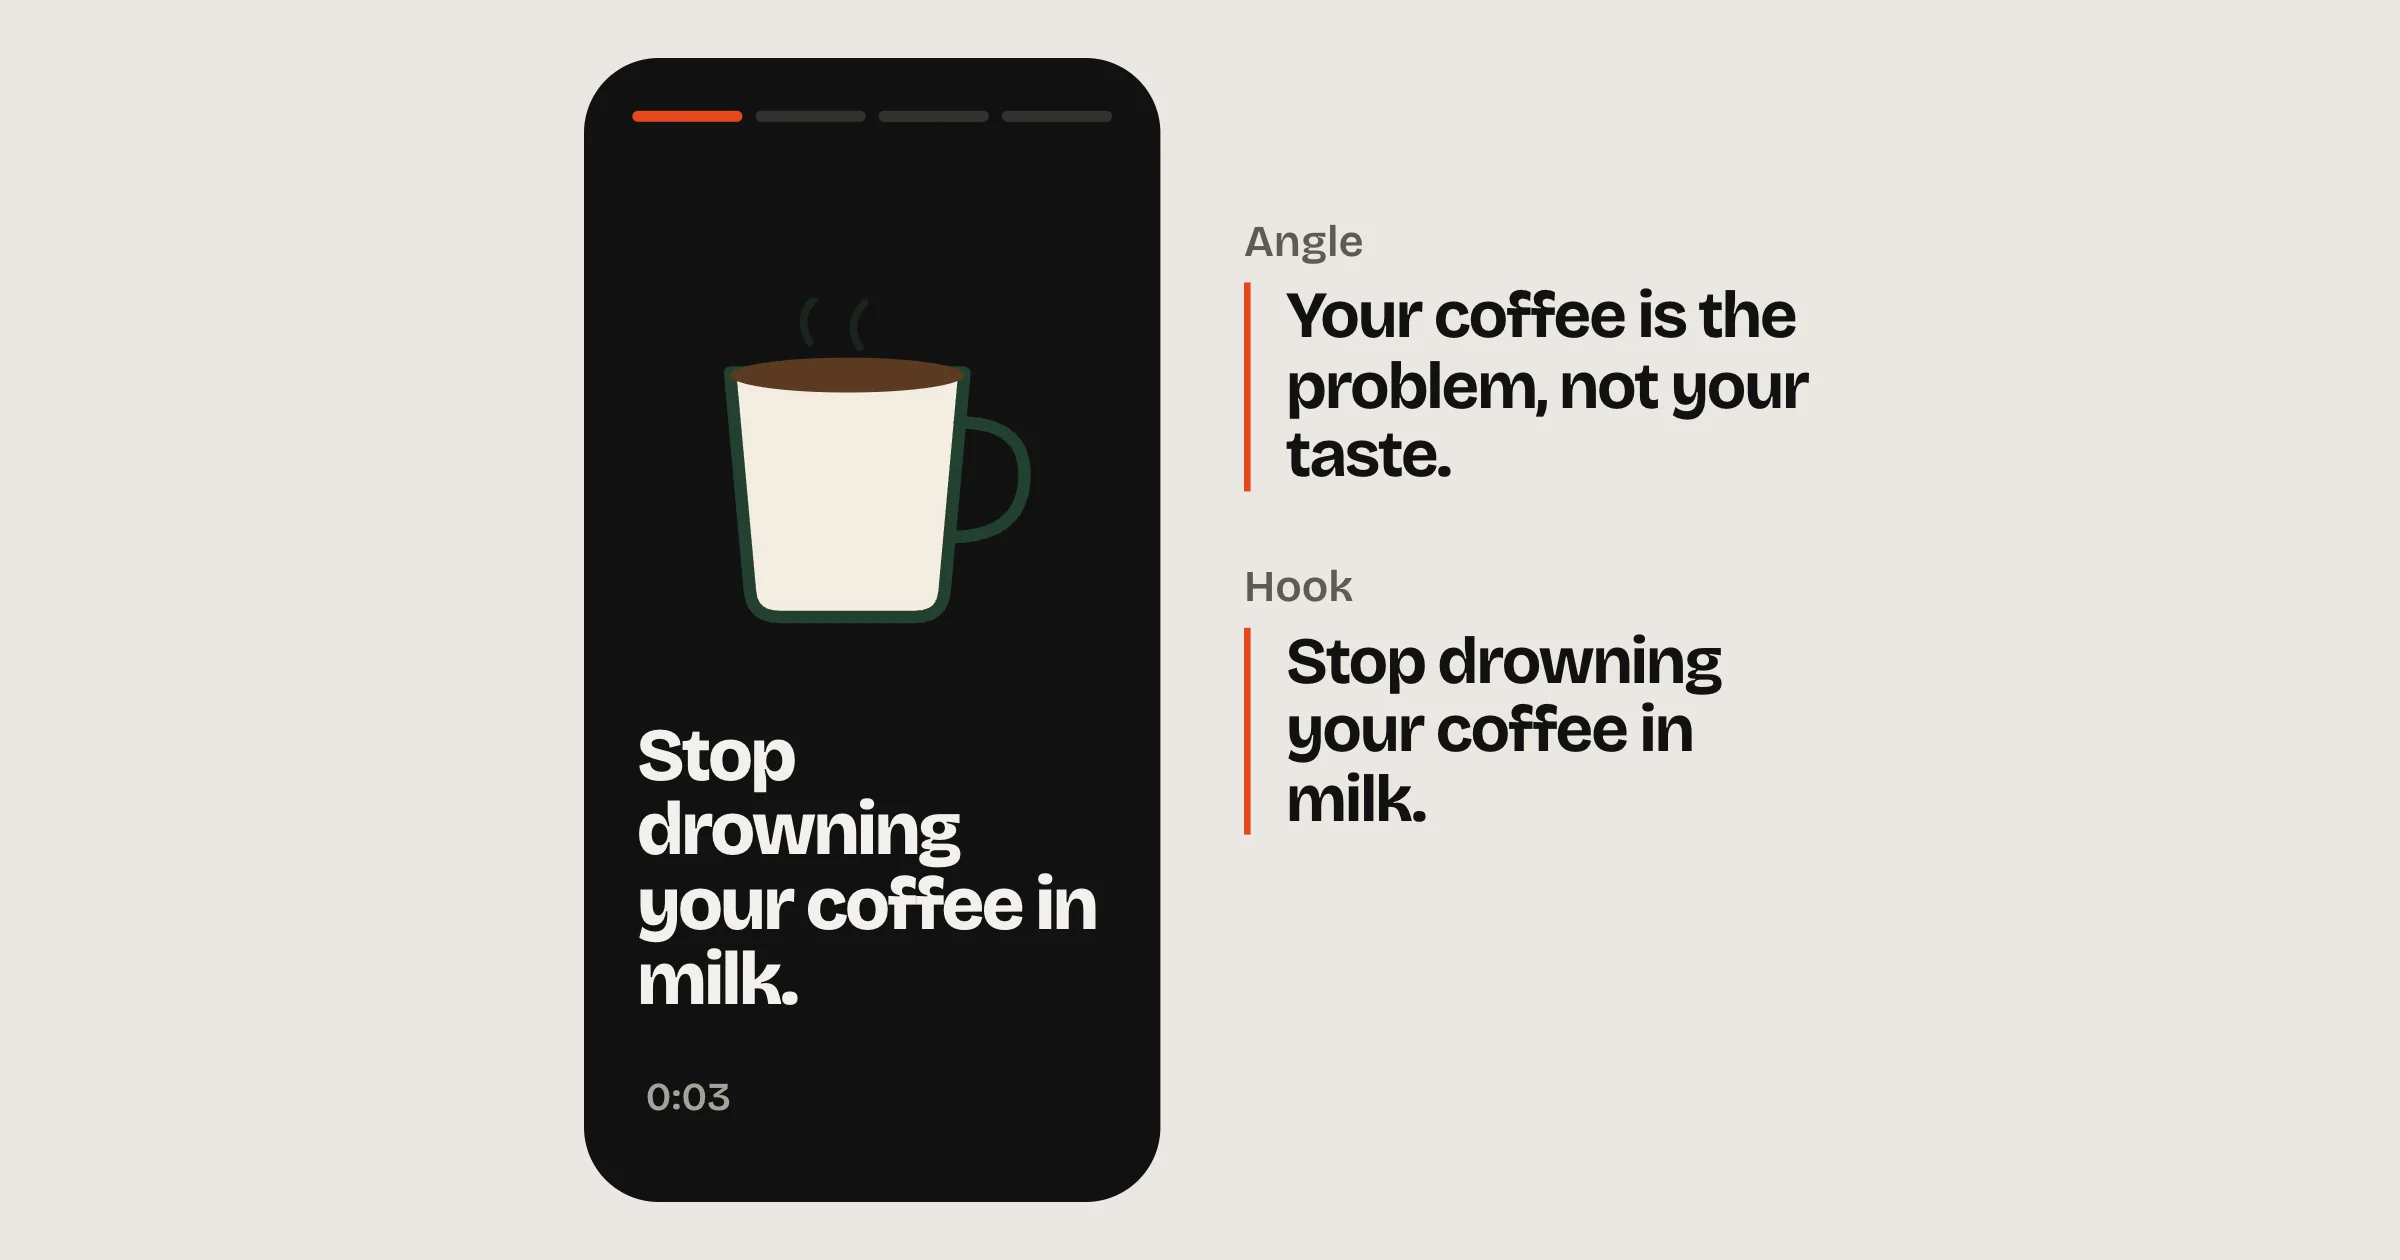
Use hook rate to compare different openings on the same video. Judge the ad itself on cost per purchase once it has 20 or more purchases behind it. We go further into openings in hooks and angles.
2. Hold rate: does the middle keep them?
Hold rate is ThruPlays divided by 3-second plays. A ThruPlay is a view of 15 seconds, or the whole video if it’s shorter. Read it next to average play time.
- High hook, low hold: the opening promises something the rest doesn’t deliver. Rewrite the body so it pays off the first line.
- Low hook, high hold: the video works and the first frame doesn’t. Cut three new openings onto the same body. It’s the cheapest new creative you’ll make.
Don’t assume short always wins. In a supplements account we run, the strongest new videos last quarter were expert-led explainers that people watched for 8 to 15 seconds on average. They earned the time because each line answered the next question a buyer would have.
3. Outbound CTR, not CTR (all)
CTR (all) counts every click: likes, profile taps, “see more”, expanding the caption. Link CTR counts link clicks, including links that keep people on Meta. Outbound CTR counts the clicks that leave Meta for your site, which is the only one that matches traffic. Meta tightened its own definition in March 2026, when click-through attribution changed to count link clicks only.
For ecom prospecting, we treat roughly 1% to 2% outbound CTR as healthy. Under 0.8% is usually a creative problem rather than an audience problem.
A high CTR isn’t automatically good news. Curiosity gets clicks. If the ad doesn’t say what you sell, a high CTR just means you paid for more people to find out on your site.
4. Landing page view rate: did they arrive?
An outbound click is counted the moment someone taps. A landing page view only counts once your page loads and the pixel fires. The gap between them is people who gave up waiting, hit a redirect, or landed on a broken link.
If fewer than about seven in ten outbound clicks become landing page views, fix the page before you touch the ad. Check it by placement too. Some placements produce clicks that rarely turn into visits, and they flatter your CTR while doing it.
5. Purchases per 100 clicks: the conversion rate that belongs to the ad
Your store’s conversion rate mixes every visitor from every channel. Purchases per 100 outbound clicks belongs to one ad. Two ads with the same CTR can be miles apart here, because they send different people with different expectations.
It’s also the fairest way to compare formats. In the pet supplements account above, video won the click (it had the higher CTR), but statics turned noticeably more of their clicks into orders. If we’d judged on CTR, we would have cut the ads that were making the money. More on that in static ad formats.
6. CPM, read in context
CPM is the price of a thousand impressions. It moves with the season, the competition, the audience, the placement, and with how Meta rates your ad. The auction weighs your bid against how likely people are to respond and how good the ad looks to them, so creative people engage with tends to buy cheaper reach.
Cheap CPMs aren’t the goal. In the same pet account, talking-head videos ran on CPMs far above the account average, which wiped out a decent conversion rate. Elsewhere, ads on cheap placements look efficient until you check purchases per 100 clicks.
Compare CPM to your own history, ideally the same month last year. November costs more for everyone.
7. Frequency, only next to CTR and cost per purchase
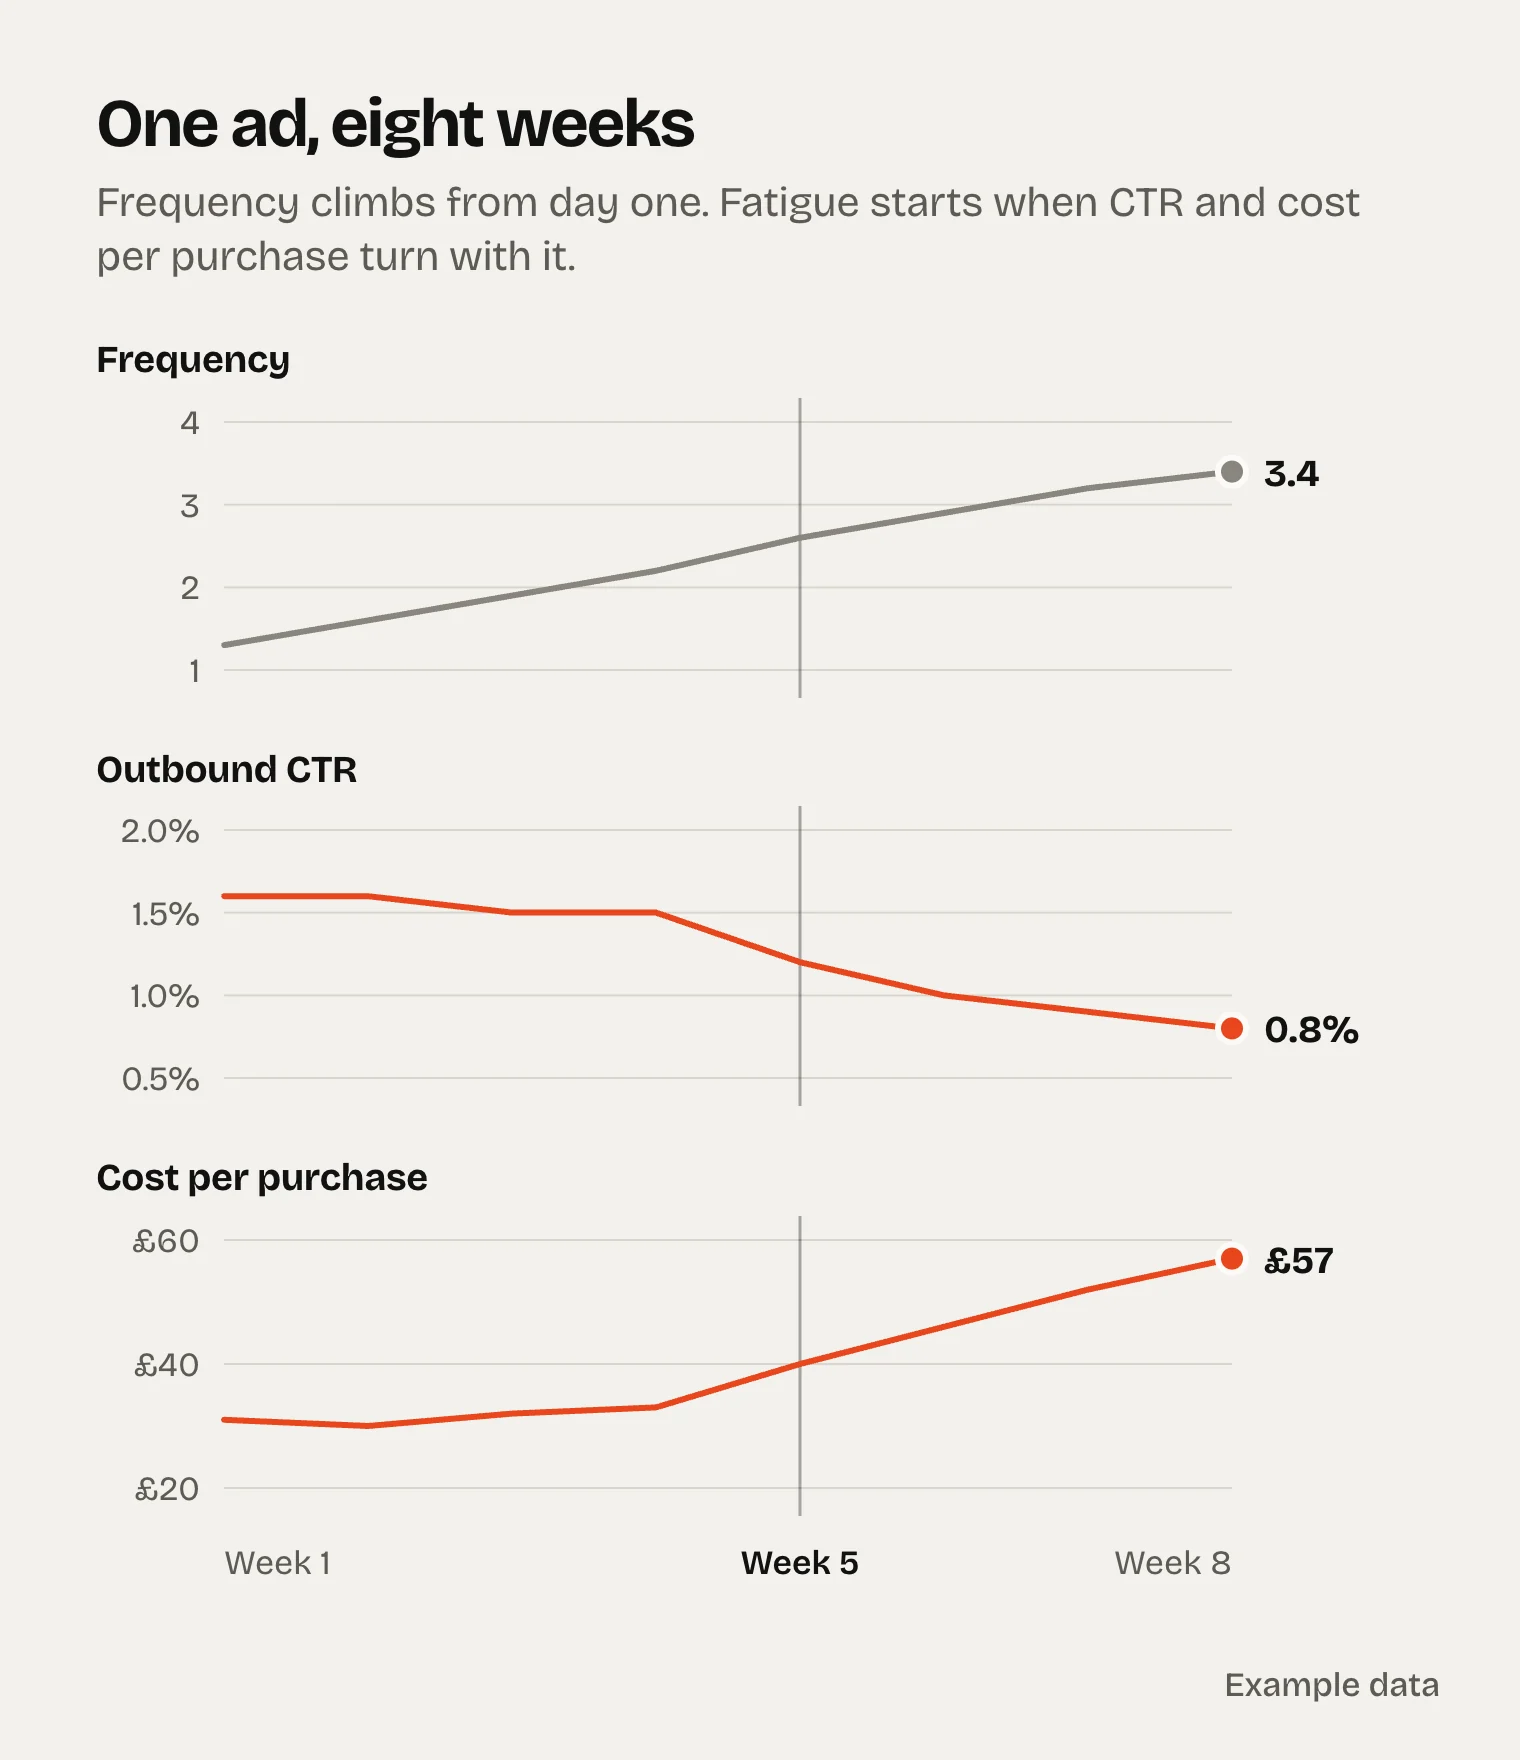
Frequency is impressions divided by reach. It rises from the day an ad launches, so a rising number on its own means nothing. Fatigue is frequency climbing while CTR falls and cost per purchase rises.
As a rough guide, we look closer when a prospecting ad passes about 2.5 a week, or retargeting passes 6 to 8, and its CTR has slid for two weeks. Meta also flags creative fatigue in the delivery column when an ad’s cost per result climbs well above similar ads you’ve run before.
The common mistake is pausing your cheapest ad because its frequency looks high. If cost per purchase is still on target, leave it alone and start briefing the replacement.
8. The attribution setting behind every number
Every purchase figure above depends on what Meta counts. The default for sales campaigns is now 7-day click, 1-day engage-through and 1-day view. Ads in the same account can run on different settings, and some accounts now use Meta’s incremental attribution model, which only optimises for conversions Meta predicts the ad caused.
Two checks before you call anything a winner:
- Compare like for like. An ad on 7-day click and 1-day view will always look better than one on 1-day click. Put them on the same setting, or compare them with the Compare attribution settings columns.
- Check the view-through share. In one account, several long-running “winners” turned out to get about half their reported sales from views rather than clicks. On a like-for-like basis, they were average.
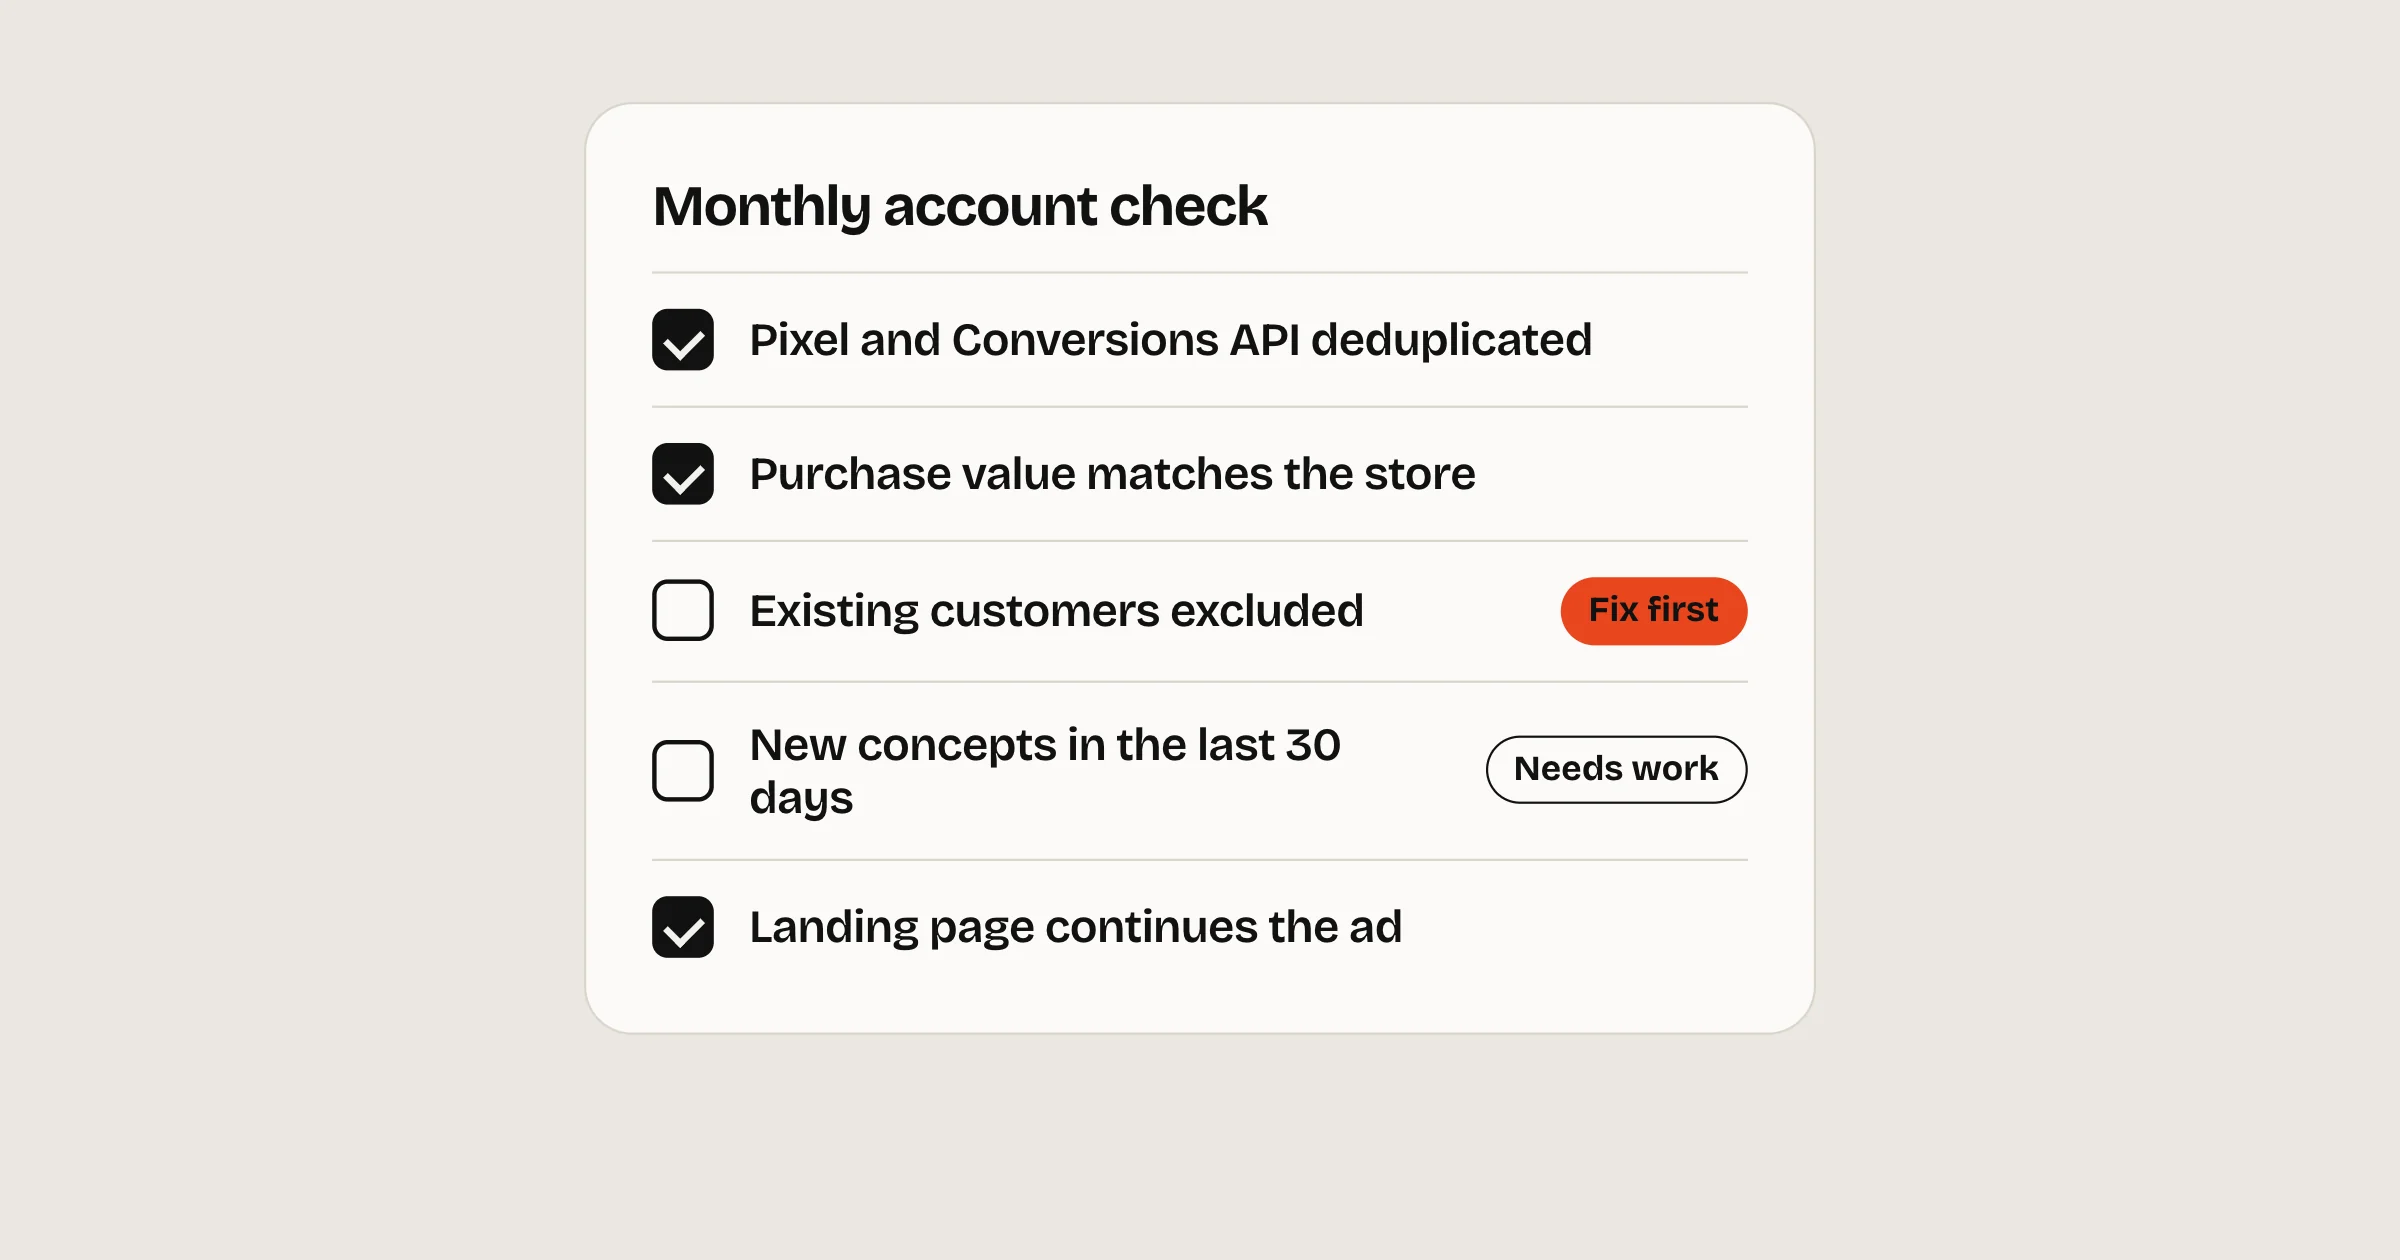
Agree the setting once, write it down, and never change it quietly. Our audit checklist starts here for a reason.
9. New-customer share
Reported cost per purchase includes people who already buy from you. If a quarter of your prospecting purchases come from existing customers, your real cost to acquire someone new is far higher than Ads Manager says.
Upload your customer list and define existing customers in your advertising settings. Ads Manager can then break results down by audience segment: new audience, engaged audience and existing customers. Check it against your store’s first-time and returning customer reports.
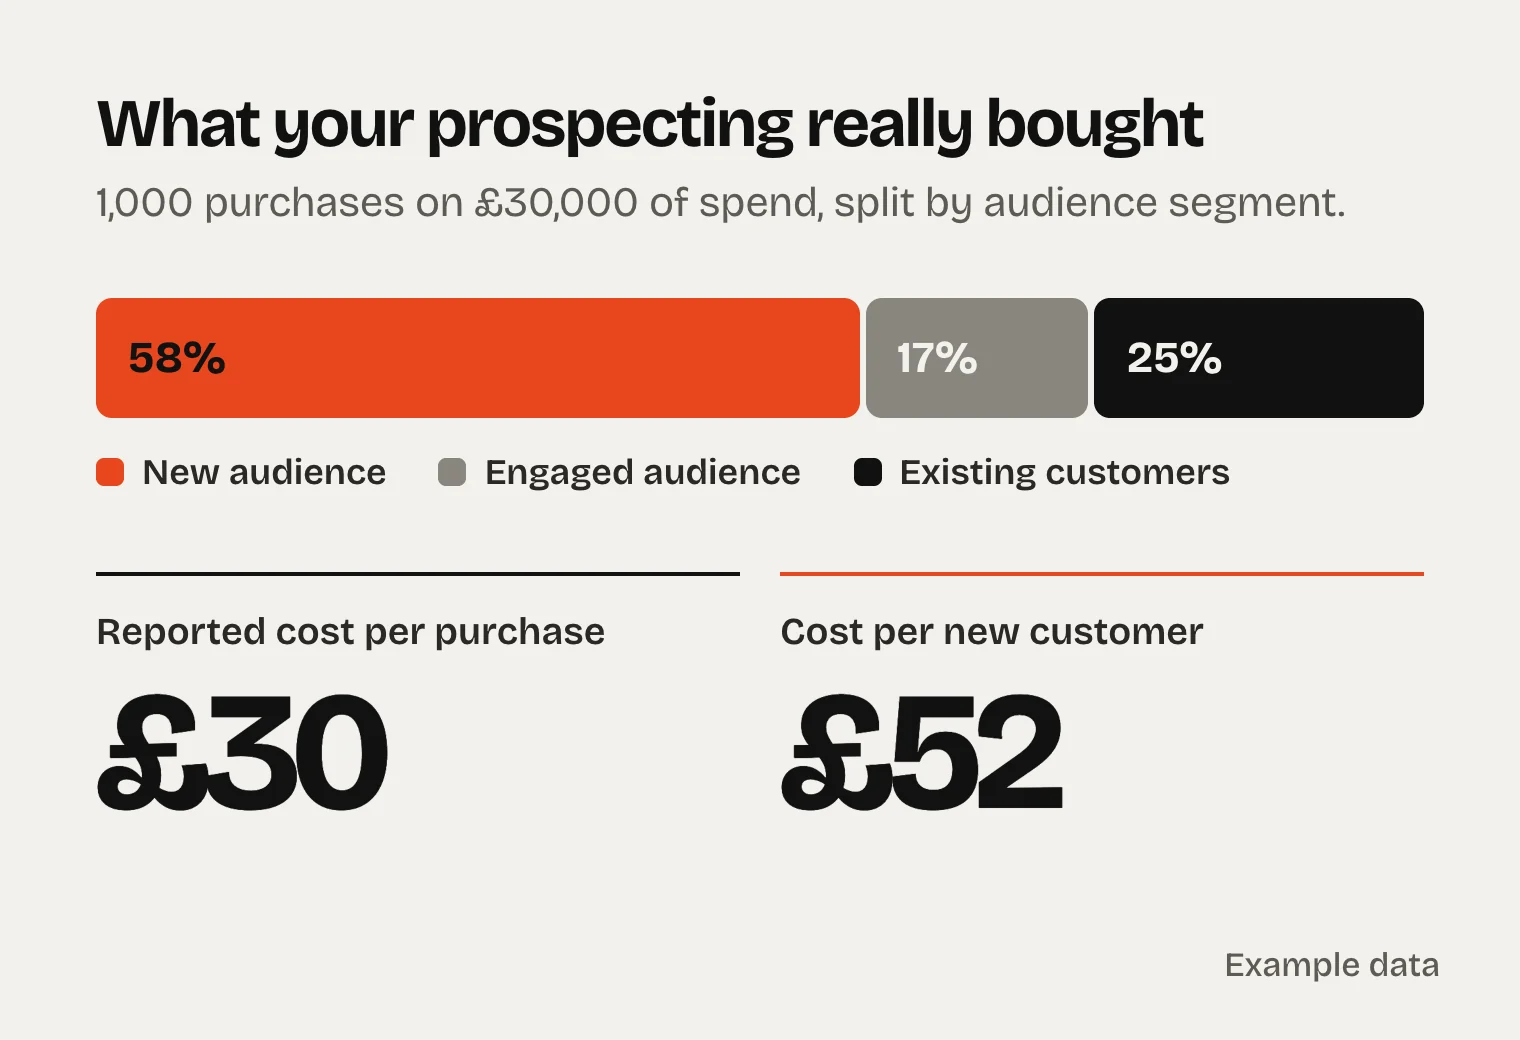
Then decide what you’re paying for. If prospecting is meant to find new customers, set its target on new-customer cost alone.
10. MER and break-even ROAS
MER is total revenue divided by total marketing spend, taken from your store rather than from Meta. It doesn’t care which channel claims the sale, which is exactly why it’s useful.
Your break-even ROAS is 1 divided by your contribution margin, meaning what’s left of a sale after product, shipping and payment costs, before ads. At a 40% margin, break-even is 2.5. A ROAS of 2.0 makes money at a 60% margin and loses money at 40%.
Watch the two together. When Meta’s ROAS climbs and MER doesn’t move, Meta is probably taking credit for sales that would have happened anyway. We won’t scale an account until we know its margin, because without a floor every ROAS is just a number.
11. Marginal ROAS: what the extra spend brought back
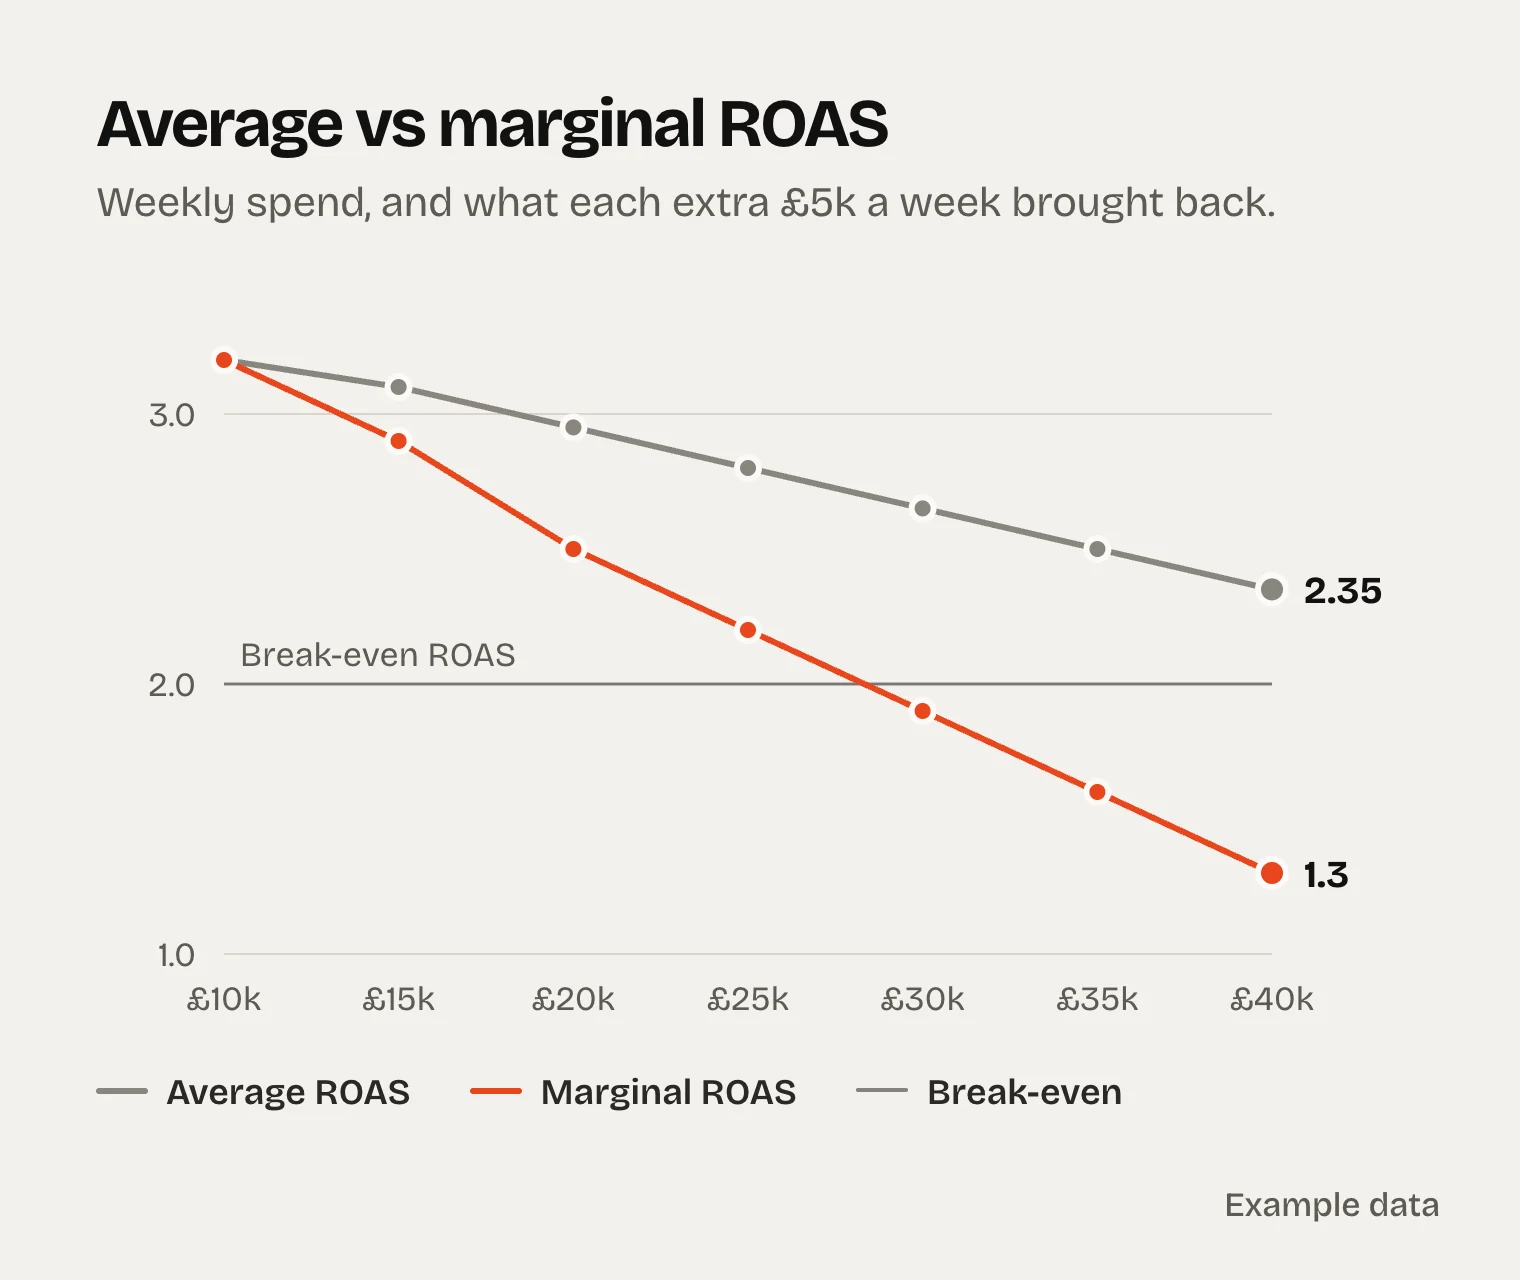
Average ROAS hides diminishing returns. Marginal ROAS asks what the extra money did on its own:
Marginal ROAS = (revenue now − revenue before) ÷ (spend now − spend before)
Compare similar weeks, and use store revenue if you can. In one account this autumn, the budget more than doubled in a month while the average ROAS slipped by less than a fifth. That looked fine. The extra spend on its own came back far below the average, which is why we raise budgets in steps of 20% to 30% and stop where marginal ROAS meets break-even.
12. Hit rate: is the creative pipeline working?
Hit rate is the share of new concepts that beat the account average once they’ve had a fair amount of spend. It tells you whether your creative process is working, not just whether one ad is.
Across two supplements accounts we ran this autumn, roughly one new concept in five beat the account average, and only a handful kept it up at real spend. So if you want two new winners a month, you need about ten genuinely different concepts, not ten versions of one.
Track spend concentration alongside it. When three ads take most of the budget and none of them are under 60 days old, the account is living on borrowed time.
How we read them together
| Number | What it tells you | Act when |
|---|---|---|
| Hook rate | The opening earns a pause | Under 20%: new first frame and line |
| Hold rate | The body keeps attention | Hook high, hold low: rewrite the body |
| Outbound CTR | People want to see more | Under 0.8%: new angle, not new audience |
| Landing page view rate | The page loads for them | Under 70%: fix speed and redirects |
| Purchases per 100 clicks | The ad sends buyers | Low next to a high CTR: fix message match |
| CPM | What attention costs | Well above your own history: check creative and placements |
| Frequency | How often people see it | Rising with falling CTR: brief the replacement |
| New-customer share | Who prospecting really reaches | Falling: set targets on new customers |
| MER | Whether the whole budget pays | Flat while Meta ROAS rises: question attribution |
| Marginal ROAS | What the next £1,000 does | Below break-even: stop raising budget |
| Hit rate | Whether testing finds winners | Under one in ten: change what you test |
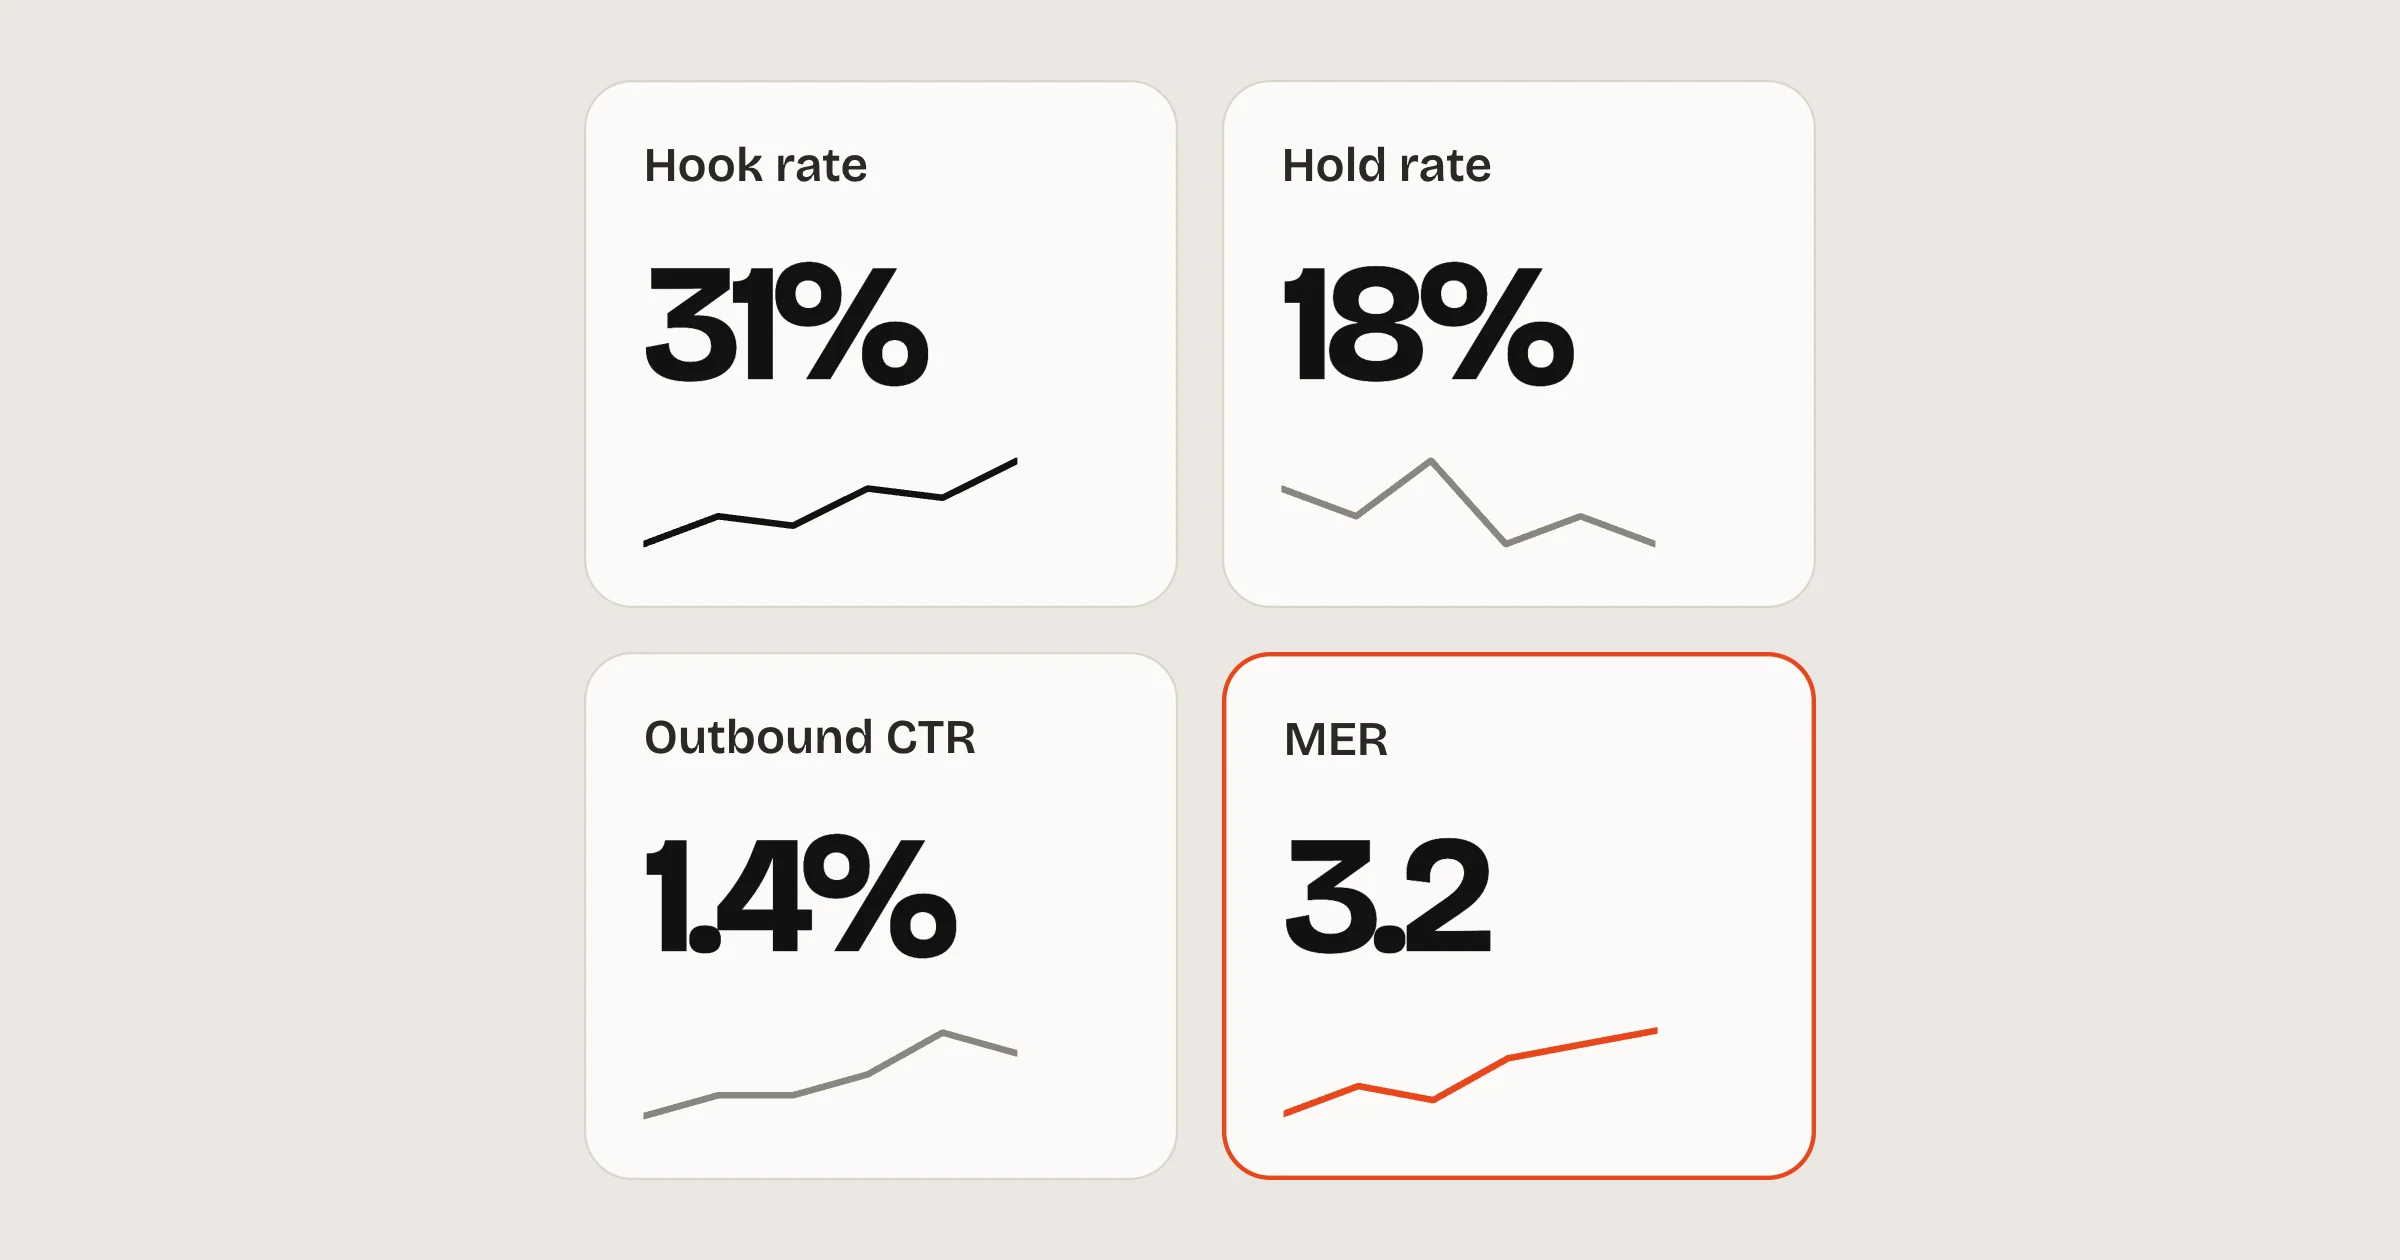
Weekly, start at the top of the account (MER, new-customer cost, marginal ROAS) to decide how much to spend. Then go down to the ads (hook, hold, CTR, page views, purchases per click) to decide what to change. Most bad decisions in Meta come from doing it the other way round.